Overview
In Part 1 we learned about Owner’s Earnings — a concept introduced by Warren Buffett to refer to the part of earnings that actually benefit shareholders.
We also learned that Free Cash Flow is a good approximation of Owner’s Earnings. It can be found on the Cash Flow Statement of a company.
This is Part 2 of the the Discounted Cash Flow model.
Near the end of part 1, I briefly talked about the Discounted Cash Flow Model.
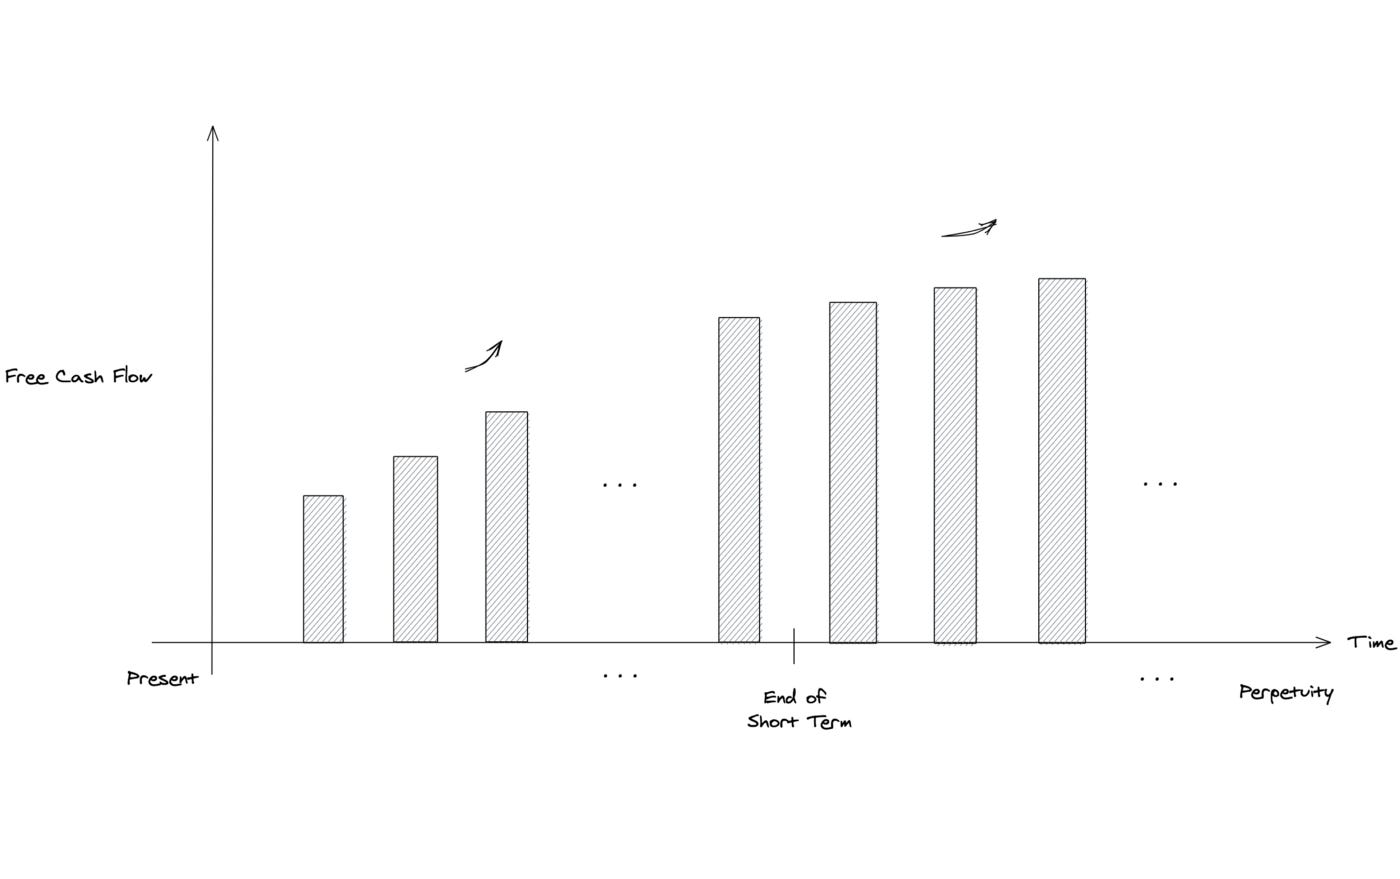
A smart investor values a piece of land by how much crop it could yield. Similarly, we value a stock by how much earnings it can generate for us. Free Cash Flows are the Owner’s Earnings.
The general idea is that in the short term, free cash flow will grow at a certain rate that is typically higher. After that the growth will slow down. We assume that the company is going to run forever and you will keep holding it and receiving your earnings.
To find the intrinsic value, we follow these 5 steps:
1. Estimate the starting free cash flow
2. Estimate the short term growth rate
3. Determine the discount rate
4. Determine the perpetuity growth rate and the perpetuity cash flows
5. Find the number of shares outstanding and calculate the Intrinsic Value
Now let’s go through each step using CVS ($CVS)
1. Estimate the starting free cash flow (fcf)
Free cash flow typically changes every year thus we take the average of the free cash flows in the past ten years.
I’m using a google spreadsheet for calculations, feel free to follow along here.
2. Estimate the short term growth rate
How many years do you think the current growth will last for? I will use 10 here. How much do you think the free cash flow will grow annually in the short term (i.e. 10 in this example)?
If you want to be conservative, you can use 3%, which is essentially saying you don’t expect the free cash flow (FCF) to grow much and instead just barely outpace the normal inflation rate (around ~ 2.0- 2.5%) of the U.S. economy.
If you instead expect stronger growth, you could use a number like 9% —or even higher
By looking at CVS’ data in the past 10 years, I am guessing there won’t be significant growth in the next 10 years, so I’m going to use 4%. On the spreadsheet this will look like:
-Year 0 = The avg fcf for the past 10 years ( we calculated this above in section 1)
-Year 1 = Year 0 value * (1 + 0.04).
-Year 2 = Year 1 value * (1 + 0.04)
and so on and so on until you reach Year 10
This is what I have so far:
3. Determine the discount rate
The discount rate is your required return on investment. We can understand the concept with an example. If Bob asks to borrow $100 from me now and promise to pay back in a year with interest, what is the minimum return rate that I will be happy with?
Well, the current reported inflation rate is 6.2%. A bank savings account gives me a ~0.06% interest rate, and the S&P500 ETFs ($SPY) generally yield a 7% annual return. So Bob’s interest rate needs to be at least 7%. Also, there is the risk that Bob might break his promise and not pay me next year, so I will add a little bit to justify that risk.
Considering all these factors (i.e. alternative investments + risks), I will require at least a 10% interest rate from Bob. This is also saying that $110 from Bob in a year (with the risk) is worth $100 to me now.
With this in mind, I will also use 10% as the discount rate to discount future cash flows from $CVS.
To discount the cash flow in the nth year, we divide the cash flow in that year by (1+0.10)ⁿ, giving us its present value.
To get the present value of short term cash flows, we simply sum the discounted free cash flows we calculated earlier from year 1 to year 10, which is $62.7 Billion
4. Determine perpetuity growth rate & cash flows
After the short term, 10 years in this example, we assume that the business will keep operating. And we will be able to receive cash flows forever. But its growth will probably slow down a bit, which is what typically happens in the real world.
To estimate the rate of growth into perpetuity, it’s generally suggested to use a conservative number and to not go higher than the estimated inflation rate. I’m going to use 6.2%.
Also be aware that for the following calculation to work, we need the perpetuity growth rate to be less than the discount rate (i.e. 10% in this example). This is a fair assumption as it is very unlikely that the company will keep growing at a rate that surpasses the return rate of all alternative investments, and with the risk considered.
Using 6.2% as the perpetuity growth rate, here is the formula to find out the present value of the sum of all cash flows in the future.
Using this formula, plugging in n = 10, C₁₀ = 12,469,874 mil, g = 6.2%, d = 10%, we will calculate the present value of all the cash flow after the 10th year:
And the result is: 134,361,899.1 mil. Since the units are in “millions of dollars”, we can simplify 134,361,899.1 million (units being a million- million) into $134.4 Bilion.
5. Calculate the Intrinsic Value
To get the present value of total cash flows, we simply sum the value of short term cash flows with the value of perpetuity cash flows that we just calculated.
Present value of the sum of short term cash flows= $62.7 Billion
Present value of the sum of perpetuity cash flows= $134.4 Billion
Present value of the total cash flows= $62.7 Billion + $134.4 Billion = $197.1 Billion
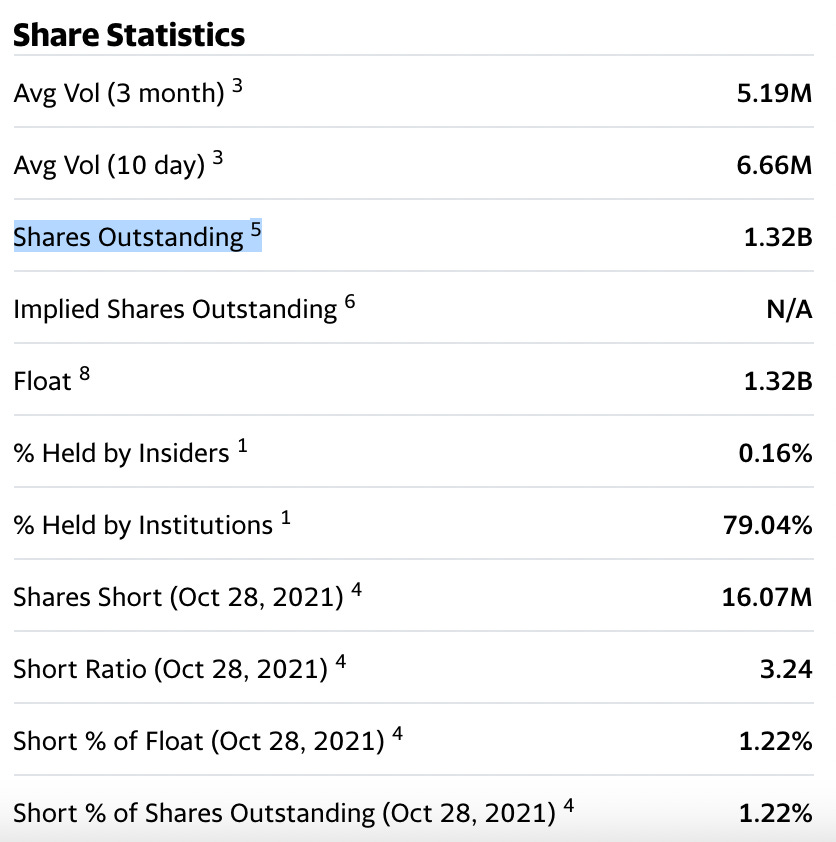
To find out the intrinsic value per share, we need to know the number of shares that the company has. This can be located on most of the financial websites under share statistics, listed as “Shares Outstanding”
The total number of shares for CVS = 1.32 Billion shares. We use this to estimate the intrinsic value:
$197.1 Billion USD ÷ 1.32 Billion Shares = $149.3/ share.
Considering that CVS trades at $94/share right now, it seems like CVS is an undervalued stock, no?
Concluding Thoughts
Our intrinsic value deviates quite a bit from the market price. Does the market undervalue CVS by THAT much? Or is there anything wrong with our models?
Firstly, it is not uncommon for the market to misprice something, as is the case with any economic bubbles.
In fact, its mispricing that sets up good opportunities for those who’re good at calculating value.
However, we also need to understand the limitations of the DCF model. The model relies on quite a few estimations — starting cash flow, short term growth rate, perpetuity growth rate and discount rate. Changes to any of these values can affect the outcome.
If you wanna experiment with different inputs, here is a spreadsheet I prepared for you. It uses a different stock’s data; feel free to make a copy and play around with it.


